1

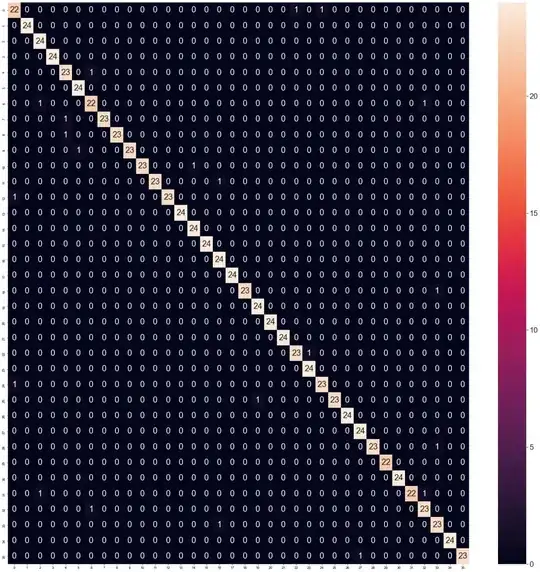
How do I add class labels to the confusion matrix? The label display number in the label not the actual value of the label Eg. labels = ['A','B','C','D','E','F','G','H','I','J','K','L','M','N','O','P','Q','R','S','T','U','V','W','X','Y','Z']

confusion matrix image

Here is the code I used to generate it.

x_train, y_train, x_test, y_test = train_images, train_labels, test_images, test_labels
model = KNeighborsClassifier(n_neighbors=7, metric='euclidean')
model.fit(x_train, y_train)
# predict labels for test data
predictions = model.predict(x_test)

# Print overall accuracy
print("KNN Accuracy = ", metrics.accuracy_score(y_test, predictions))

# Print confusion matrix
cm = confusion_matrix(y_test, predictions)

plt.subplots(figsize=(30, 30))         # Sample figsize in inches
sns.set(font_scale=2)
sns.heatmap(cm, annot=True)
seyinia
  • 23
  • 5

3 Answers3

0

You can use the xticklabels and yticklabels arguments for this as specified in the seaborn documentation. See also the following answer on a different question on the datascience stackexchange.

Oxbowerce
  • 7,077
  • 2
  • 8
  • 22
0

You can also pass the correctly labeled predictions to the confusion matrix.

from sklearn.preprocessing import LabelEncoder
from sklearn.metrics import ConfusionMatrixDisplay

labelEnc = LabelEncoder()
y = labelEnc.fit_transform(...) # Encode string-labels with numbers.
ConfusionMatrixDisplay.from_predictions(
    labelEnc.inverse_transform(y_test), # Decode numbers to string-labels.
    labelEnc.inverse_transform(y_pred))
```
0

You can first define your labels an use that in xticklabels and yticklabels values.

import seaborn as sns
import matplotlib.pyplot as plt
from sklearn.metrics import confusion_matrix
from sklearn.neighbors import KNeighborsClassifier
from sklearn import metrics

#defined your labels
labels = ['A','B','C','D','E','F','G','H','I','J','K','L','M','N','O','P','Q','R','S','T','U','V','W','X','Y','Z']

# you have already trained your model and obtained predictions

# Print confusion matrix
cm = confusion_matrix(y_test, predictions)

# Plot confusion matrix with class labels
plt.subplots(figsize=(30, 30))
sns.set(font_scale=2)
sns.heatmap(cm, annot=True, xticklabels=labels, yticklabels=labels)
plt.xlabel('Predicted')
plt.ylabel('True')
plt.show()
Rina
  • 165
  • 1
  • 13