I have a time series on daily stock price of company(2013 data points).I took a first order difference and the following acf and pacf plots of the differenced series were obtained. However, I am unable to come up with a suitable ARMA model. Can anyone please help me with this?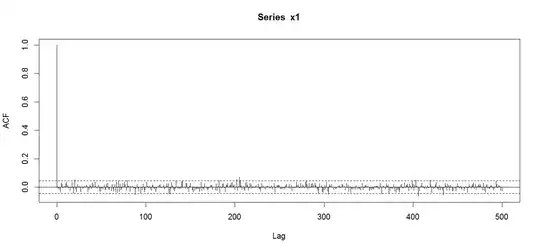
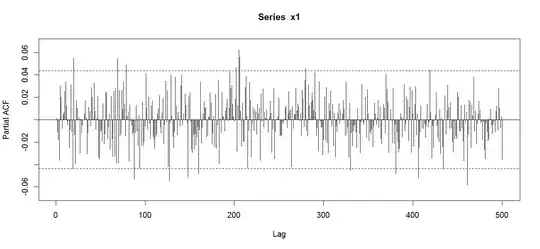 !
!
The above plots don't seem to converge to zero and the acf and pacf values are significant at high lags which I wonder would be appropriate to consider for orders in ARMA model.
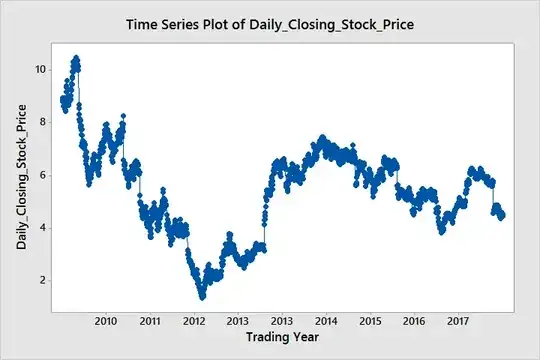
The graph given below is that of the original series.