2

According to uniaxial stress strain curve, specimen fails at a certain stress value since necking begins.

My question is that, same stress value appears before necking especially around yield point however specimen keeps its integrity and continue up to uts point and then rupture. Why ?

dancineer
  • 71
  • 4
  • Failure is a relative term. Failure means that a component is no longer suitable for its designed purpose. If any plastic deformation is undesirable, then necking is failure. If some plastic deformation is ok, like in say wire drawing, then necking is not failure. Failure is often conflated with the term rupture, which means separation into two pieces by an intervening crack via applied stress. – do-the-thing-please Feb 27 '19 at 13:17

1 Answers1

1

It just seems the way you mention because most of the books use the so called engineering graph. Which assumes the specimen surface area as constant throughout the loading which as we know is not right. Under tension the specimen extends axially and becomes narrower by the Poison's contraction.

So if we just plot stress versus strain curve without modifying the stress due to reduction in cross section of the specimen we get the known curve with straight elastic part and the large extension under higher stress due to hardening and the brittle rupture.

Because at the first point on the graph stress level the specimen is still ductile and has flexibility to accept even a little bit higher stress and keep stretching while it becomes harder and more brittle.

So after a large expansion it has lost almost all its ductility and it starts a sort of free fall elongation without increasing the stress and breaks at that point. In reality there is never negative slope on the curve and it keeps rising albeit with different shapes at distinct stress levels. The Wikipedia graph shows this, the blue curve,B, is the real and thered,A, is the engineering curve..enter image description here

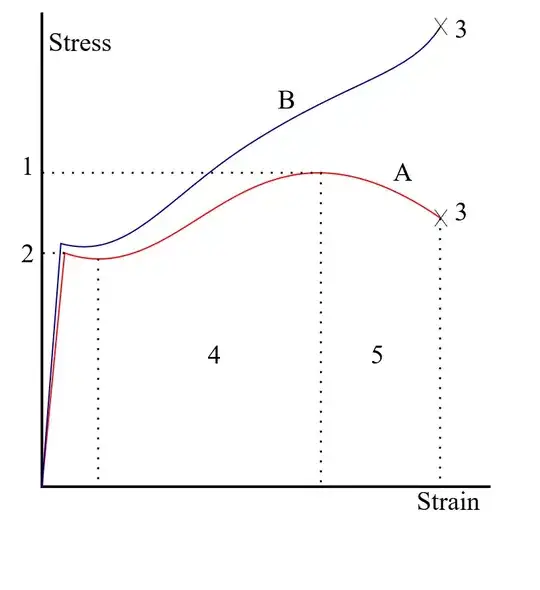
They explain this clearly here.Wikipedia Stress/strain

kamran
  • 21,714
  • 2
  • 18
  • 38
  • 2
    Curve A is definitely "real" in the sense that it is what you measure if you do a tensile test, but to understand why it happens you need the fact that *plastic strain occurs at constant volume*. Any geometrical imperfection that causes a smaller cross section area in a tensile test specimen is *unstable*. The smaller area produces higher stress (= force / area) which produces more plastic strain which reduces the area more as the length increases. Curve B, corrected for the change in area, is the data you need to input to computer software to do a material nonlinear analysis. – alephzero Feb 27 '19 at 11:09
  • 1
    @alephzero, 'plastic strain occurs at constant volume' quote. neither part seems to be correct, poisons contraction applies at elastic range too. and the volume of specimen doesn't stay constant necessarily. say you pull a one meter long square bar by 1cm to 101 cm, with a now reduced area of 0.997 cm square. so the volume after extraction is 0.997*0.997*101= 100.394cc <101cc. After yield point the geometry of the specimen is not uniform axially due to the necking. Curve A is raw data which needs correction. – kamran Feb 27 '19 at 14:43