2

I recently stumbled across the water tunnel videos by this guy:

enter image description here

https://youtu.be/quDLzxmJl5I?t=838

He states that for his "high flow" experiments the water speed is at 0.668 m/s. The car model is about 18 cm long. From what I understand about Reynolds numbers this equates to Re = 134702:

${{0.997 g/cm³ * 0.668 m/s * 18 cm} \over {8.9e-4 Pa s}} = 134702$

For roughly the same Re in air and the full car size of 4.5 m in air I come up with a speed of 0.433 m/s (1.56 km/h):

${{134702 * 1.8448e-5 Pa s} \over {0.001275 g/cm³ * 4.5 m}} = 0.433 m/s$

I like to believe that my thinking here is wrong, as the flow lines in his experiments look "to scale". But from my calculations above it seems that his 0.668 m/s seem to low to represent typical driving speeds at scale?

So to make this a question:

(edited) How are water tunnel experiments equivalent to wind tunnel experiments if, from my napkin calculations above, it seems that to simulate air flow at x km/h you need about the same flow velocity in water?

ToxicOwl
  • 349
  • 1
  • 2
  • 10
fho
  • 135
  • 5
  • According to [Sabatino et al. (2016)](https://www.researchgate.net/publication/303784988_Hydrogen_Bubble_Flow_Visualization) (pdf free to read), regarding the hydrogen bubble visualization technique applied in the video: _"The technique provides a relatively simple and low-cost flow visualization which utilizes the process of electrolysis in water ows to create material sheets and time lines of very small hydrogen bubbles."_. Is this the sort of information you had in mind? – ToxicOwl Jul 17 '22 at 21:41
  • You need to check out kinematic similarity, dynamic similarity and geometric similarity. Decide what needs to be matched then adjust other parameters to suit. – Solar Mike Jul 18 '22 at 06:47
  • @ToxicOwl No, the question is more about the required medium speeds. From the napkin calculations I do there it seems that to get to equivalent Re numbers at the 1:25 scale Gray is using the water would have to flow about the same speed as equivalent flows in air. I looked up some water tunnels and most of them do not go higher than 1 m/s. So it seems water tunnels seem to be fairly limited in the experiments they allow? – fho Jul 19 '22 at 08:03
  • 1m/s in water ratioed with density and viscosity differences gives? – Solar Mike Jul 19 '22 at 08:08
  • @SolarMike basically the same speed in air if I understand Reynolds number correctly (I updated the question to include the calculations, but they have been behind the links before) – fho Jul 19 '22 at 08:39
  • So massively different car size... – Solar Mike Jul 19 '22 at 08:42
  • @SolarMike Different car sizes do not change the fact that the simulated speed is orders of magnitude of from speeds that would be interesting in real cars. – fho Jul 19 '22 at 08:54
  • Oh, good so you are sorted then? Given that water has a density of 1000kg/m^3 and air is about 1.2kg/m^3 (less on these hot days...) why do you think there is so little difference in your answers? – Solar Mike Jul 19 '22 at 09:36
  • Let us [continue this discussion in chat](https://chat.stackexchange.com/rooms/137889/discussion-between-fho-and-solar-mike). – fho Jul 19 '22 at 10:39

2 Answers2

1

TL;DR Your calculations are correct. As stated by [1], "In flow situations that are insensitive to Reynolds number, or where a test Reynolds number is close to that of a full-size vehicle, water tunnels should be regarded as the preferred option for experimental aerodynamics". Water tunnels are regarded as a valid approach, but the applicability need to be assessed on a case-by-case basis, mostly due to the discrepency often seen in the Reynolds number. Since the obective of the video is to give a basic understanding of the flow, I consider the simplifications valid.


Since the topic at hand is way to large to be satisfactory explained in a SE answer, I highly recommend those interested to have a look at [1]. They greatly compare and discuss the differences in using wind and water tunnels for areodynamic problems. Rather than motor vehicles, their study is focused around air vehicles, which also suits your question.

In the YouTube video you are referencing, from about 5:00-9:00, GraysGarage briefly describes some methods for experimental fluid dynamics, stating that the current objective is to investigate the flow pattern. By not aiming to calculate e.g. drag and lift forces, some scaling errors w.r.t. to the Reynolds number may be neglified.

I suspect the main reason for using a water tunnel in this case is the decreased free-stream velocity obtained due to the high viscosity of water compared to air. This enables easier visualization of complex flow patterns, and consequently a better understanding of the flow dynamics.

However, for the flow pattern obtained in a water tunnel to be representative for a real-life scaled model, some criterias must be satisfied. As is given in Table 1, "the Reynolds number for tests on a model in a water tunnel is at least three orders of magnitude less than that for tests on a full-size vehicle" [1]. For cases where Reynolds numbers are of high importance, such as flow around a circular cylinder, this difference is crucial when interpreting the results. An example of this is seen in the drag coefficent as a function of Reynolds number in Figure 1. [1] states that "Loads measured and flow patterns captured in water tunnels for models with rounded leading edges do not scale well to full-size vehicles, due to different types of boundary layers and separation locations for the two cases". Interestingly, it should also be noted how the use of a wind tunnel still has a difference in Reynolds number when investigating air vehicles, suggesting that care should also be taken when extrapolating such results.

Since the flow patterns of the cars investigated by GraysGarage are dominated by mostly sharp edges in the geometry, I personally believe the flow patterns obtained are representative for use in obtaining a basic understanding of the flow. As GraysGarage also points out, more detailed methods must be applied to achieve the full flow pattern. Then, as is somewhat discussed in the comments on his YouTube video, one should also consider the error obtained by the stationary wheels, which in reality will have large effects on the flow. However, such an analysis was never the intent of GraysGarage, so I therefore consider it off-topic.

table1 
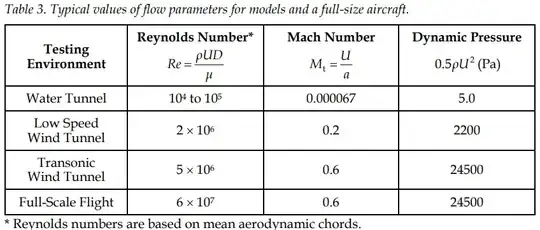
Table 1 Table from [1, p. 4]

figure1 
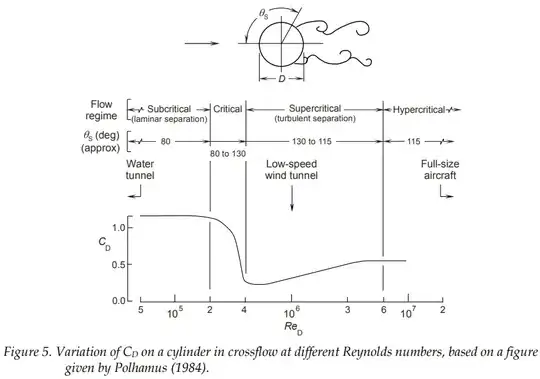
Figure 1 Figure from [1, p. 10]

Lastly, [2] is attached to give some further insight to the benefits and drawbacks of flow visualization using Hydrogen Bubbles. GraysGarage also touches on the topic, describing how the use of e.g. dye is disregarded due to the contamination of the water and the following purification needed to start over again. Another benefit is the possibility to create pulses of bubbles travelling downstream, as is applied in the video. This gives a unique possibility to watch how each "particle" behaves inside the flow.


[1] Erm, Lincoln P. & OL, Michael V. (2012). An Assessment of the Usefulness of Water Tunnels for Aerodynamic Investigations. URL: https://apps.dtic.mil/sti/pdfs/ADA582450.pdf

[2] Smith, Charles & Sabatino, Daniel & Praisner, Thomas & Seal, Charles. (2012). Hydrogen Bubble Flow Visualization. URL: https://www.researchgate.net/publication/303784988_Hydrogen_Bubble_Flow_Visualization

ToxicOwl
  • 349
  • 1
  • 2
  • 10
  • Thanks! That's more throughout than I would have hoped for! – fho Jul 25 '22 at 08:29
  • 1
    Static wheels might be off-topic, but from my limited insight into the topic it seems that a static ground might actually negatively influence the results? – fho Jul 25 '22 at 09:06
  • 1
    I'm not experienced enough in the specifics of flow dynamics around a car to give a definite answer, but for the purpose of a basic understanding, I believe the affect of a static ground may be confidently neglified as well. If going into detail however, I agree that both the static ground (and the discrepency in boundary layer that occurs since the free-flowing fluid moves tangential to the ground, which it should not), and the effect of moving tires (example by Rice University: https://www.youtube.com/watch?v=MRuxoXhZQXk) should be included. In addition to other details of course.. – ToxicOwl Jul 25 '22 at 09:48
0

If the flow pattern in the water tunnel experiment is identical to the wind tunnel experiment, then you can correlate the data as:

$Re = \dfrac{u_wL}{\nu_w} = \dfrac{u_aL}{\nu_a}$

Or, use the method described in this article under the title: "Similarity of flows".

r13
  • 7,917
  • 3
  • 8
  • 27